
Field Notes
How to Identify Technocapital Gravity Wells
Thomas Laffont of Coatue recently presented this slide at an “All In” event.
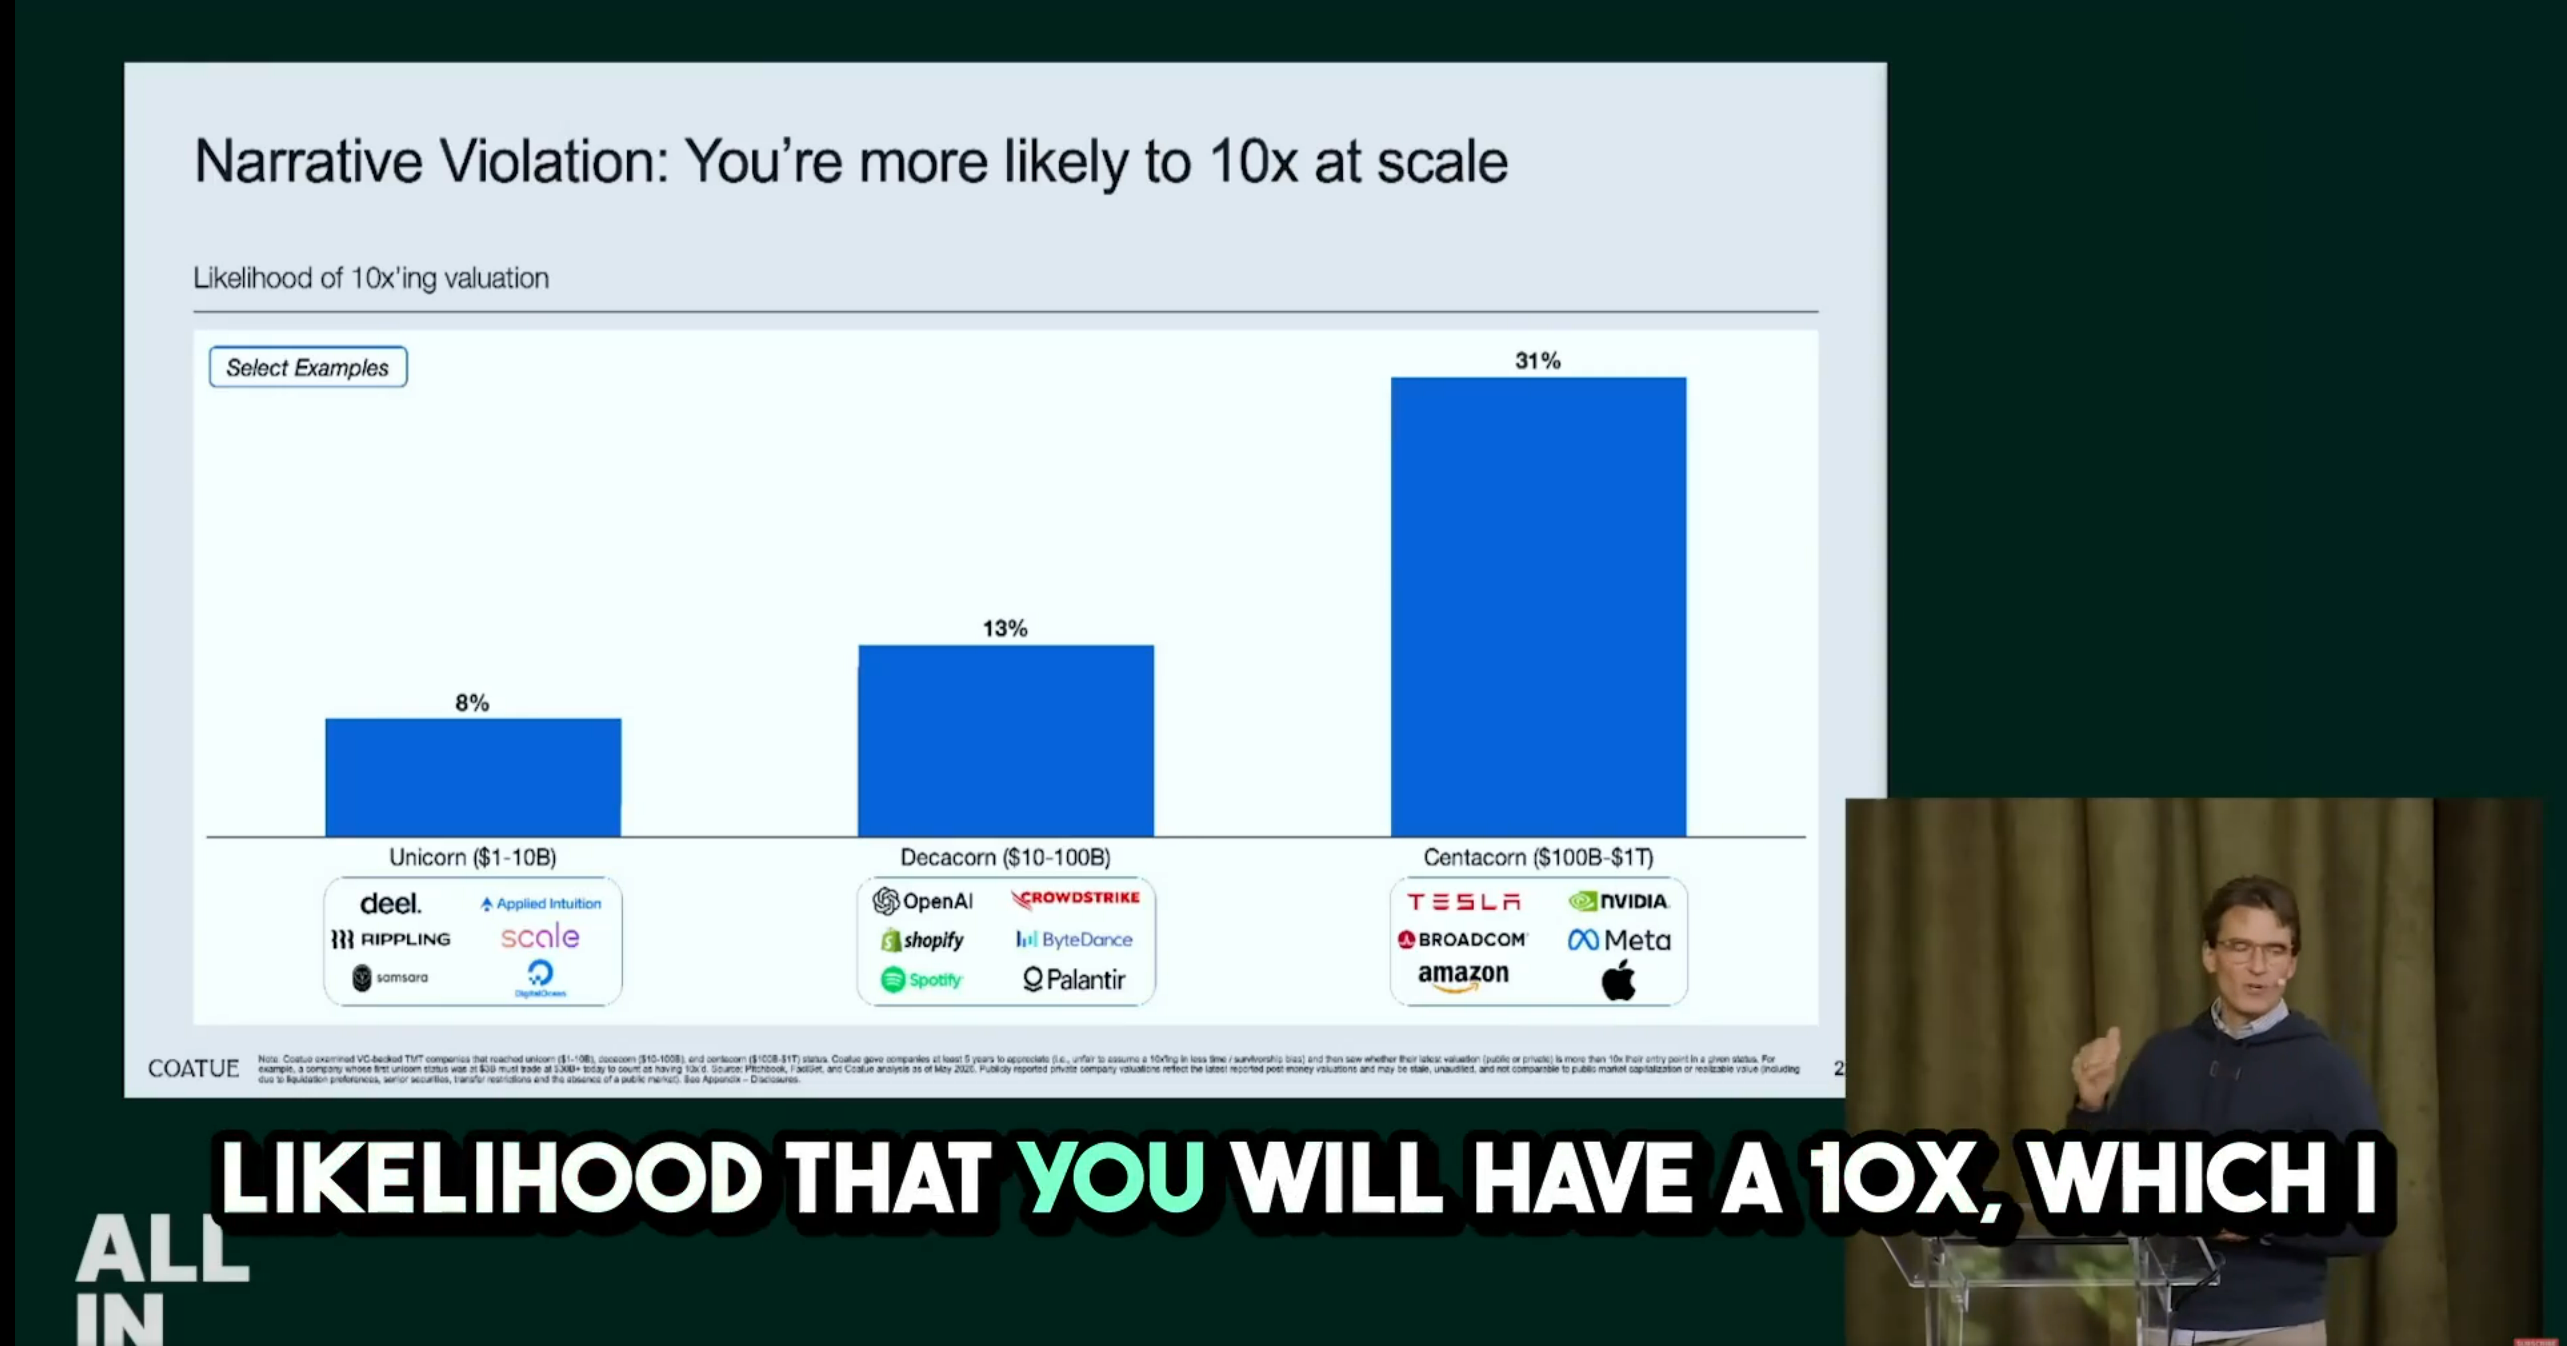
The claim is that larger companies have a higher probability of 10x-ing in value compared to smaller companies. Specifically, if you reach 100 billion in market cap, you have a 31% probability of hitting 1 trillion market cap.
I suspected there were errors with his methodology so I tried to reproduce it using historical public market data. I actually tried it for a few different countries, and the results were inconclusive from what I could tell.
Actually, to be clear, I’m sure that if you tailor a screener you can come up with a result like this. One thing I’ve learned over and over is that you can very easily prove almost any hypothesis you want with historical data depending on how you slice it. Backtests lie: or rather - backtests often do not have much predictive power for the future and you need to be very careful about how you design them.
Anyway, that’s not really where I wanted to go with this post.
I wanted to actually show what I believe is a very simple rule of thumb for which companies will be very huge in the future.
Market Cap + Growth Rate.
I did a little experiment and pulled some data:
- top 20 largest companies by market cap
- 10 years apart
- highlighted revenue growth rates
I think you are going to be surprised how easy it is to guess which companies will drop out of the top 20 list and which ones will stay in the list.
Top 20 companies by market cap: March 2006
| Rank | Company | Mkt cap | FY2006 revenue | 3yr avg rev growth | 1yr rev growth | P/S |
|---|---|---|---|---|---|---|
| 1 | Exxon Mobil | $446B | $377.6B | 15.7% | 1.9% | 1.2x |
| 2 | General Electric | $383B | $158.5B | 6.6% | 18.5% | 2.4x |
| 3 | Total S.A. / TotalEnergies | $327B | $173.6B | 10.7% | 2.9% | 1.9x |
| 4 | Microsoft | $293B | $46.1B | 10.4% | 11.4% | 6.4x |
| 5 | Citigroup | $273B | $89.6B | 5.0% | 7.1% | 3.0x |
| 6 | PetroChina | $252B | $86.7B | 33.5% | 25.9% | 2.9x |
| 7 | Bank of America | $239B | $69.4B | 21.6% | 22.1% | 3.4x |
| 8 | Royal Dutch Shell | $231B | $318.9B | N/M† | 4.0% | 0.7x |
| 9 | BP | $221B | $265.9B | N/M† | 10.9% | 0.8x |
| 10 | Toyota | $215B | $196.2B | 11.3% | 6.1% | 1.1x |
| 11 | Procter & Gamble | $203B | $73.6B | 16.2% | 19.3% | 2.8x |
| 12 | Walmart | $192B | $348.7B | 10.5% | 11.1% | 0.6x |
| 13 | Johnson & Johnson | $191B | $53.3B | 8.5% | 5.6% | 3.6x |
| 14 | Pfizer | $186B | $48.4B | 3.0% | -2.1% | 3.8x |
| 15 | AIG | $186B | $113.4B | 11.9% | 4.1% | 1.6x |
| 16 | Altria | $179B | $60.8B | 0.4%‡ | -11.8%‡ | 2.9x |
| 17 | China Mobile | $171B | $37.5B | 26.3% | 26.6% | 4.6x |
| 18 | Berkshire Hathaway | $169B | $98.5B | 15.6%§ | 20.7%§ | 1.7x |
| 19 | JPMorgan Chase | $167B | $61.8B | 23.1%§ | 14.1%§ | 2.7x |
| 20 | Cisco | $165B | $31.9B | 17.4% | 23.1% | 5.2x |
Top 20 companies by market cap: March 2016
You can see a lot of the old list is still in here.
But we lost some: Citigroup, Total, RDS, Toyota, Pfizer, AIG, Altria. Notice anything about these? They had lower growth rates.
Many of the fast growers show up again: Microsoft, PetroChina, P&G, Walmart, JPMorgan Chase.
Some more tech companies have now poked in - in fact the fruits of the internet are starting to pay off. 5 of the top 10 are arguably internet companies.
| Rank | Company | Mkt cap | Revenue used | 3yr avg rev growth | P/S |
|---|---|---|---|---|---|
| 1 | Apple | $604B | $235.0B | 12.7% | 2.6x |
| 2 | Alphabet | $518B | $75.0B | 15.3% | 6.9x |
| 3 | Microsoft | $437B | $88.1B | 6.9% | 5.0x |
| 4 | Berkshire Hathaway | $350B | $210.8B | 9.1% | 1.7x |
| 5 | Exxon Mobil | $347B | $259.5B | -15.0% | 1.3x |
| 6 | Facebook / Meta | $325B | $17.9B | 52.3% | 18.1x |
| 7 | Johnson & Johnson | $298B | $70.1B | 1.5% | 4.3x |
| 8 | General Electric | $295B | $105.9B | -8.8% | 2.8x |
| 9 | Amazon | $280B | $107.0B | 20.5% | 2.6x |
| 10 | Wells Fargo | $245B | $83.8B | -0.3% | 2.9x |
| 11 | AT&T | $241B | $146.8B | 4.9% | 1.6x |
| 12 | Nestlé | $239B | $90.2B | -2.7% | 2.7x |
| 13 | China Mobile | $228B | ~$103.2B | 4.2% | 2.2x |
| 14 | ICBC | $228B | $110.4B | 9.2% | 2.1x |
| 15 | Procter & Gamble | $223B | $68.2B | -6.4% | 3.3x |
| 16 | Verizon | $221B | $131.6B | 4.3% | 1.7x |
| 17 | JPMorgan Chase | $217B | $93.0B | -1.4% | 2.3x |
| 18 | Walmart | $215B | $482.1B | 0.9% | 0.4x |
| 19 | Roche | $214B | $48.7B | -0.6% | 4.4x |
| 20 | PetroChina | $205B | $274.0B | -6.7% | 0.7x |
Top 20 companies by market cap: March 2026
Notice these slow growers are now gone: Exxon, J&J, GE, Wells Fargo, AT&T, Nestle, China Mobile, ICBC, P&G, Verizon, Roche, PetroChina.
Basically the old world of banks, telecoms, oil, and food companies is not compounding anymore. They hit some terminal path and now all the growth is elsewhere.
We have a new crop of technology companies that have revealed themselves: the AI companies. Yes, the old winners of the internet are still around and some of them are successfully becoming AI companies, but there are a whole bunch of chipmakers here that were not on the list before.
| Rank | Company | Mkt cap / valuation | Revenue used | 3yr avg rev growth | 1yr rev growth | P/S |
|---|---|---|---|---|---|---|
| 1 | NVIDIA | $4.969T | $215.9B | 101.8% | 65.5% | 23.0x |
| 2 | Alphabet | $4.367T | $402.8B | 12.5% | 15.1% | 10.8x |
| 3 | Apple | $4.275T | $416.2B | 1.9% | 6.4% | 10.3x |
| 4 | Microsoft | $2.902T | $281.7B | 12.5% | 14.9% | 10.3x |
| 5 | Amazon | $2.566T | $716.9B | 11.7% | 12.4% | 3.6x |
| 6 | TSMC | $2.198T | $121.9B | 19.6% | 38.0% | 18.0x |
| 7 | SpaceX | $2.104T | $18.7B | 33.0%* | 33.0%* | 112.7x |
| 8 | Broadcom | $1.817T | $68.3B | 26.2% | 25.2% | 26.6x |
| 9 | Saudi Aramco | $1.752T | $448.6B | -9.2% | -6.7% | 3.9x |
| 10 | Tesla | $1.526T | $94.8B | 5.6% | -2.9% | 16.1x |
| 11 | Meta | $1.439T | $201.0B | 19.9% | 22.2% | 7.2x |
| 12 | Samsung | $1.394T | $235.7B | 1.1% | 7.7% | 5.9x |
| 13 | Micron | $1.106T | $42.3B | 28.3% | 45.4% | 26.1x |
| 14 | Berkshire Hathaway | $1.055T | $424.2B | 16.7%† | -3.4%† | 2.5x |
| 15 | Eli Lilly | $1.010T | $65.2B | 32.1% | 44.7% | 15.5x |
| 16 | SK Hynix | $1.005T | $68.7B | 36.1% | 43.3% | 14.6x |
| 17 | Anthropic | $965B | $47.0B run-rate | 800%* | 800%* | 20.5x |
| 18 | Walmart | $963B | $713.2B | 5.3% | 4.7% | 1.4x |
| 19 | JPMorgan Chase | $859B | $182.4B | 12.5%† | 7.7%† | 4.7x |
| 20 | OpenAI | $852B | $25.0B annualized | 233%* | 233%* | 34.1x |
What is the list likely to look like in 10 years?
I would guess many of these companies will be gone from the list. In particular here are a couple of slow growers:
- Saudi Aramco
- Tesla (although they seem to have a ton of irons in the fire, let’s see?)
- Samsung
- Apple
- Walmart
- JPMorgan Chase
Who else might be gone? Potentially Micron and SK Hynix since they produce memory and it’s in a temporary shortage. But what’s so interesting now is that this list is almost entirely tech companies except for Lilly, Berkshire, Saudi Aramco, Walmart, and JPMorgan Chase. In particular, among these names, Lilly is the outlier here with a very strong growth rate.
Something happened (I think you know what) to really alter the makeup of this list.
You could also read this as: the internet has reached terminal saturation and we are at peak tech company. The tides may shift, as evidenced by companies like Lilly coming back into focus.
Lilly is an interesting case to study here: they are on the cutting edge of something genuinely changing the real world - GLP1 drugs. This kind of biotechnology will be further enabled by technology advances.
My personal prediction: there will be a new crop of companies which are currently private and focused on applying the fruits of AI to the real world. They will harness AI advances and apply them to robotics, biology, and material science. There will also be a new thrust toward space, as evidenced by SpaceX.
Technocapital Acceleration
Another thing you may have noticed: the largest company in 2016 was only 1.5x as large as the largest company in 2006.
But in 2026, Nvidia is 8 times larger than Apple was in 2016. Amazon grew revenue 7x. Is this a bubble? Is this inflation? Maybe, but in the previous lists we only saw one revenue growth rate above 50% in 2016, and the highest in 2006 was 33%. However, the largest company today grew at 65% last year (and higher before that), and there are some companies on this list that might be growing at hundreds of percent a year.
We are in some kind of takeoff / inflection point / pivotal moment. 2036 is going to look very different.