
Field Notes
I Upgraded Postgres from 15 to 18 and Benchmarked My Actual Queries
Quick Summary
tl;dr: I upgraded Hallucination Yield from Postgres 15.19 to 18.6 and measured four of the queries the app actually uses. In the paired comparison, median execution time fell about 26% for the AI screener, 14% for power coverage, and 33% for the Taiwan growth screener. The SEC screener moved only 3%, which is small relative to the variation in the measurements. The slowest query is still a multi-second query. No magic there.
A separate memory experiment on 18 brought the power query down another 28% against its new baseline. More memory did very little for the slow Taiwan query. I kept 2 GiB of shared buffers and 16 MiB of working memory in production.
There is a catch with doing this kind of benchmark: if you dump your database and restore it into a new version, you also rebuild the tables and indexes and collect fresh planner statistics. So I did a second comparison with the same backup restored into both versions.
Why I wanted to try this
Back in March I wrote about the stack I like for building with AI. One of my points was that maintenance tasks were getting much easier to actually do instead of endlessly putting them off.
Well, this is a pretty good example. I wanted to upgrade Postgres, but I also wanted to know if it made my app faster. Not a synthetic transactions-per-second number. The big SQL statements my app is already running.
Hallucination Yield started as a way to survey LLMs about stocks and compare their answers. It now also ingests company financials, Taiwan monthly revenue, semiconductor data, power data, and a bunch of other datasets. Some of the screens have fairly involved queries: latest-revision selection, rolling financial windows, multiple joins, aggregates, and rankings.
PostgreSQL 18.6 was the latest stable release when I ran this on November 2, 2026. PostgreSQL 19 was still a release candidate.
The extremely normal server
This is a single Debian machine running Docker Compose. Express, a BullMQ worker, Postgres, Redis, and object storage run on the same box. nginx sits in front of the API. Other services share the machine too.
| Component | What I used |
|---|---|
| CPU | AMD Ryzen 5 3500U, 4 cores / 8 threads |
| RAM visible to Linux | 12.61 GiB |
| OS | Debian 13, kernel 6.12.113+deb13-amd64 |
| Database disk | Lexar NM790 1 TB NVMe, ext4, noatime |
| Database container | Alpine / musl, x86-64; 15.19 before, 18.6 after |
| Alpine release | 3.24.1 before, 3.24.3 after |
| Docker shared memory | 64 MiB |
PostgreSQL shared_buffers | 128 MiB |
work_mem | 4 MiB |
effective_cache_size | 4 GiB |
| Parallel workers per gather | 2 |
| JIT | Enabled |
random_page_cost | 4 |
| Statistics target | 100 |
The 15.19 container was our existing locally maintained image; 18.6 used the pinned official image. This compares the deployed container builds, not two binaries compiled against an identical userspace. Production also moved from data checksums off to on; both control clusters use checksums on.
Yes, those Postgres memory settings are small. I left the common settings alone for the version comparisons below, then tested memory tuning separately in the third experiment.
The source database occupied 22.63 GiB, including indexes and TOAST storage. Exact counts across 146 application tables added up to 29,601,515 rows. Here are a few of the tables, rather than pretending the whole database is one uniform workload:
| Table | Exact rows | PG 15 source, MiB | PG 18 restored, MiB |
|---|---|---|---|
market_candle | 24,094,948 | 10,418.2 | 8,543.6 |
observation | 169,605 | 42.0 | 36.6 |
run | 36,005 | 75.0 | 74.9 |
mops_monthly_revenue | 193,960 | 263.6 | 200.2 |
sec_financial_period | 28,733 | 553.6 | 64.9 |
semiconductor_observation | 274,479 | 1,227.4 | 420.6 |
semiconductor_interval_observation | 86,884 | 367.1 | 110.1 |
Sizes include indexes and TOAST. The 24 million market candles dominate storage, but these four queries mostly work on smaller financial and observation tables. This is not a benchmark of scanning all 29.6 million rows.
What I measured
| Query | What the app is doing |
|---|---|
| AI stock screener | Find each stock’s latest successful run per selected model, pivot the three prediction horizons, average across models, join financial metrics, return 100 stocks |
| Taiwan growth screener | Select the latest monthly revenue revisions, calculate annual and trailing revenue growth, join price and market-cap data, score and filter companies |
| SEC financial screener | Select preferred filings, self-join prior quarters and years, calculate rolling revenue, rank each company’s latest quarter, return 100 companies |
| Power coverage | Rank monthly and hourly revisions, union the canonical observations, count series and observations across eight sources |
The SQL came from the application services, whose files matched the deployed code byte for byte. I substituted fixed literals for the application’s parameters. The Taiwan screener’s date is pinned to 2026-11-02, so the freshness filters do not change between runs.
Each query gets two warm-up executions followed by nine measured executions. Query order is shuffled with a fixed seed. The paired restore comparison also shuffles which Postgres version runs first for each query.
EXPLAIN (
  ANALYZE,
  BUFFERS,
  SETTINGS,
  FORMAT JSON,
  TIMING OFF
)
-- the application's SELECT goes here
;
The numbers below are median server execution time, in milliseconds. Planning time is recorded separately in the downloadable results. They do not include API caches, HTTP, connection setup, or delivering the result rows to the browser. TIMING OFF disables per-node clock measurements; PostgreSQL still reports total execution time. See the EXPLAIN documentation.
I did not drop Linux’s filesystem caches. These are repeated-query measurements on a shared server, not cold-disk tests or a concurrency/load benchmark. A PostgreSQL shared-buffer read is not necessarily a physical NVMe read: Linux may already have the page cached.
First: the actual production upgrade
The API and worker were stopped, remaining database sessions were disconnected, and the old database was set read-only. That gave the comparison a fixed dataset.
I made a fresh custom-format dump, saved the global roles and the old configuration separately, recorded a SHA-256 checksum, and restored the dump into a separate versioned directory. The old Postgres 15 cluster stayed intact.
The dump was 2.49 GiB and took 196 seconds. Restoring into Postgres 18 took 473 seconds, followed by ANALYZE and validation. A separate off-server copy of the dump and recovery configuration passed the same SHA-256 check on my backup machine.
Before resuming writes, I checked all 146 table counts, all sequence values, and order-independent SHA-256 fingerprints of the four query results. All matched. The API, worker, and database passed health checks after the switch. Public health, stock-screener, and latest-opinion requests also succeeded. The maintenance period, including repeated benchmarks and validation, was about 18 minutes.
| Query | PG 15.19 median, ms | PG 18.6 median, ms | Reduction in elapsed time |
|---|---|---|---|
| AI stock screener | 200.4 | 193.5 | 3.4% |
| Power coverage | 1,195.5 | 988.0 | 17.4% |
| SEC financial screener | 559.2 | 449.4 | 19.6% |
| Taiwan growth screener | 5,539.0 | 4,085.9 | 26.2% |
The medians all improved in this run, but the AI screener moved only slightly and its observed ranges overlap substantially. This table combines the version change with fresh tables, rebuilt indexes, fresh statistics, and normal shared-server variability. The off-server backup transfer was also running during these measurements.
A fresh restore also changed the database’s physical size from 22.63 GiB to 13.93 GiB. The old cluster was retained, so the host still holds that additional recovery copy. The timing table includes the effects of rebuilding the database as well as changing versions.
Second: restore the same backup into both versions
For the more useful version comparison, I restored the same frozen dump into a PostgreSQL 15 control. For the PostgreSQL 18 control, I preserved an offline copy of the already-restored cluster before the app resumed writes. The two isolated containers therefore contained the same frozen data. Both got fresh statistics with vacuumdb --analyze-in-stages. Both had data checksums enabled and the same common memory and planner settings.
The production app was back online for this part, so background load is still a limitation. The two test databases were isolated from the network, and the measured queries ran one at a time, alternating versions in randomized order. Neither test database received application writes.
| Query | PG 15.19 median, ms | PG 18.6 median, ms | Reduction in elapsed time |
|---|---|---|---|
| AI stock screener | 242.0 | 178.6 | 26.2% |
| Power coverage | 1,036.9 | 889.1 | 14.3% |
| SEC financial screener | 438.0 | 424.5 | 3.1% |
| Taiwan growth screener | 4,984.6 | 3,335.2 | 33.1% |
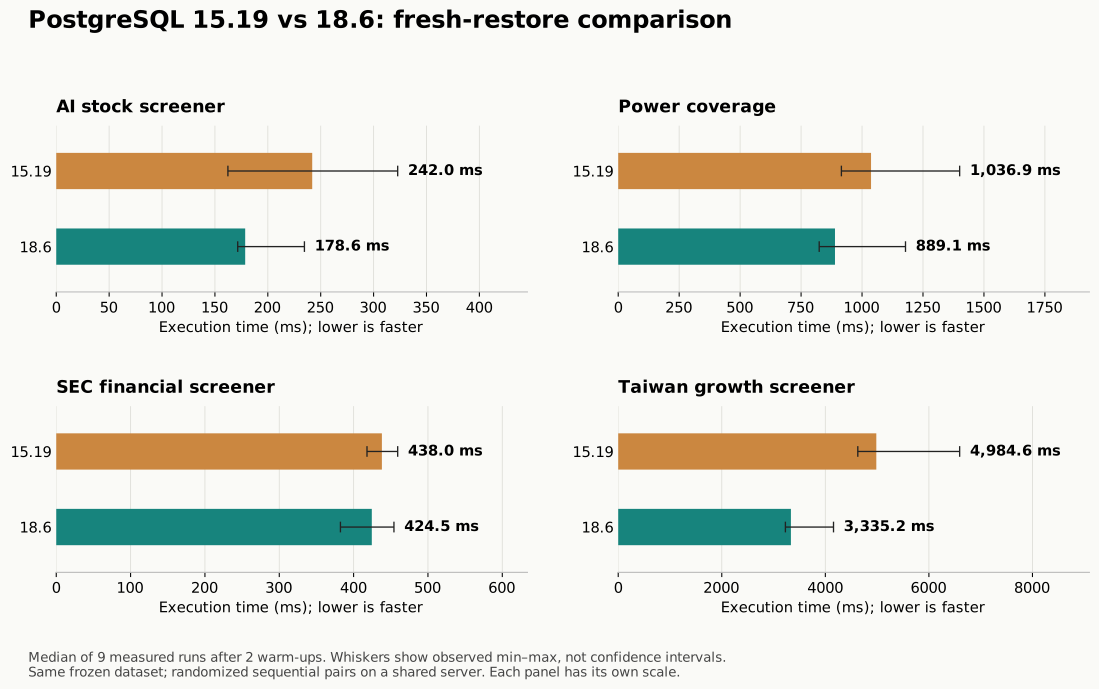
Each panel has its own time scale. Whiskers are the observed range of nine runs, not confidence intervals.
The Taiwan result was the clearest one in this small sample: 4.98 seconds became 3.34 seconds. Its measured ranges were 4.63–6.59 seconds on 15 and 3.23–4.16 seconds on 18. The query still takes several seconds, but saving roughly 1.65 seconds is useful.
The AI and power medians also improved, although their ranges overlap. Individual runs did not all favor 18. For example, the AI query ranged from 162–323 ms on 15 and 172–235 ms on 18. I would not turn a nine-run median into a promise about every request.
The SEC result is the one I would have overstated from the first table. Production before/after showed about a 20% improvement. Once both databases had been rebuilt, the medians were 438 ms and 424 ms, with substantially overlapping ranges. For this test I would call that roughly unchanged.
The two control databases were almost the same size: 13.91 GiB for 15 and 13.93 GiB for 18. The large storage reduction also happens when restoring back into 15, which is useful evidence that the shrink was a rebuild effect.
These are nine observations per query per version, not confidence intervals or a claim about every Postgres workload. The result fingerprints matched the pre-upgrade snapshot for both restores.
Third: what if I actually give Postgres some memory?
After the version comparison, the obvious next question was the tiny memory settings. This machine has 12.61 GiB available to Linux. Postgres was using a 128 MiB shared cache and allowing 4 MiB per working operation. There was room to try more.
I took a new live physical snapshot with pg_basebackup and verified it with pg_verifybackup. This snapshot is later than the upgrade’s frozen dump, so this section has its own baseline. The four SQL files are byte-identical to the earlier experiment. I did not change indexes, rewrite queries, or collect new planner statistics between memory profiles.
Two settings do different jobs. shared_buffers is Postgres’s shared page cache. work_mem governs memory for operations such as sorts and hashes before they spill to temporary files; it is not a total budget for a connection. A query can have several such operations, parallel workers can add more, and hash operations have a separate multiplier, which stayed at 2. The Postgres memory documentation explains the distinction.
I tested 128 MiB and 2 GiB of shared buffers, each with 4, 16, and 64 MiB of working memory. effective_cache_size stayed at 4 GiB throughout. That setting is an estimate for the planner, not an allocation of RAM.
The isolated test container used the same physical snapshot for every profile. It had a 6 GiB memory limit, no additional swap allowance, and the same 64 MiB Docker shared-memory mount. Autovacuum was disabled only on this disposable copy to preserve its statistics. Production remained online.
Within each cache size, query/work-memory pairs ran in shuffled order: two warm-ups, then nine measured executions per pair. Changing shared buffers required restarting the container, so I ran the small-cache profiles, then the large-cache profiles, then repeated the original 128 MiB / 4 MiB baseline. Linux’s filesystem cache was not flushed.
All numbers below are median execution time in milliseconds:
| Shared buffers | Working memory | AI screener | Power coverage | SEC screener | Taiwan screener |
|---|---|---|---|---|---|
| 128 MiB | 4 MiB | 170.1 | 843.4 | 393.2 | 3,206.3 |
| 128 MiB | 16 MiB | 153.2 | 709.4 | 355.6 | 3,180.0 |
| 128 MiB | 64 MiB | 153.1 | 687.4 | 311.2 | 3,099.7 |
| 2 GiB | 4 MiB | 156.3 | 738.4 | 387.9 | 3,193.8 |
| 2 GiB | 16 MiB | 144.3 | 608.0 | 357.5 | 3,228.3 |
| 2 GiB | 64 MiB | 144.0 | 612.7 | 305.7 | 3,144.4 |
| 128 MiB (repeat) | 4 MiB | 162.9 | 814.6 | 382.8 | 3,230.1 |
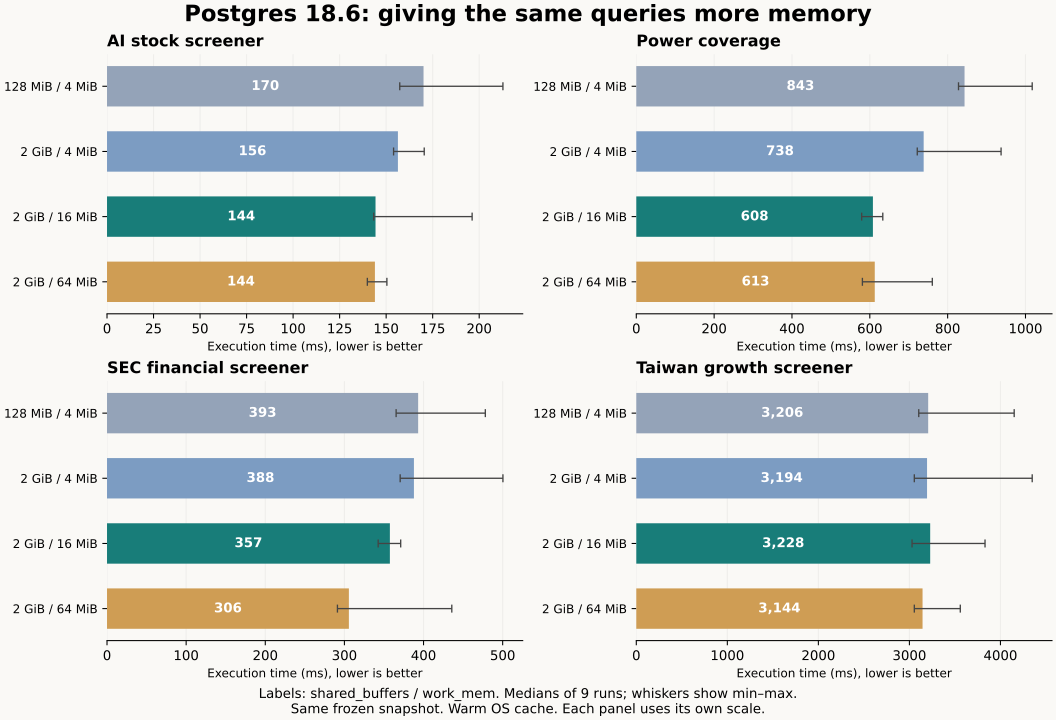
The chart shows four of the six configurations. Each panel has its own scale. Whiskers show the observed minimum and maximum, not confidence intervals.
The final baseline repeat matters here. AI went from 170.1 to 162.9 ms without keeping any tuning. Power went from 843.4 to 814.6 ms, SEC from 393.2 to 382.8 ms, and Taiwan from 3,206.3 to 3,230.1 ms. There is ordinary drift on this shared machine. These are small samples, and several ranges overlap.
Even with that qualification, the power query was the clearest memory win. At 2 GiB shared buffers / 16 MiB working memory, its median was 608.0 ms, about 28% below the starting baseline and 25% below the repeated baseline. AI improved about 15% against the starting baseline and SEC about 9%. Taiwan was essentially unchanged, about 0.7% slower.
The buffer counters help explain what changed. With the 2 GiB cache, every measured execution of these four queries reported zero shared-buffer reads after warm-up. The smaller cache kept reading blocks back into Postgres. Those reads could still come from Linux’s cache, so this does not establish that we eliminated NVMe reads.
The other change was temporary files:
| Query | 4 MiB work_mem | 16 MiB work_mem | 64 MiB work_mem |
|---|---|---|---|
| AI stock screener | 715 | 0 | 0 |
| Power coverage | 2,892 | 0 | 0 |
| SEC financial screener | 7,604 | 3,792 | 0 |
| Taiwan growth screener | 2,494 | 0 | 0 |
These are median temporary blocks written with 2 GiB shared buffers. Each block is 8 KiB; this is write volume, not peak temporary-file size.
The Taiwan result is the interesting disappointment. Its temporary writes disappeared at 16 MiB, but the query still took about 3.2 seconds. Giving the repeated aggregation more memory did not make the repeated work go away.
The SEC query did benefit from 64 MiB: its median fell to 305.7 ms, about 22% below the starting baseline. AI and power gained little beyond 16 MiB, and Taiwan stayed in the same general range. So I kept 2 GiB shared buffers and 16 MiB work_mem as the production settings. A separately measured, transaction-local 64 MiB allowance for the SEC query is a possible follow-up. It is not part of this change.
Here are all three stages side by side, using the paired-restore version comparison and the memory settings I kept in production. Query timings are medians in milliseconds:
| Query / setting | Postgres 15.19 | Postgres 18.6 | Postgres 18.6 + more memory |
|---|---|---|---|
| AI stock screener | 242.0 | 178.6 | 144.3 |
| Power coverage | 1,036.9 | 889.1 | 608.0 |
| SEC financial screener | 438.0 | 424.5 | 357.5 |
| Taiwan growth screener | 4,984.6 | 3,335.2 | 3,228.3 |
shared_buffers | 128 MiB | 128 MiB | 2 GiB |
work_mem | 4 MiB | 4 MiB | 16 MiB |
The first two columns share the upgrade’s frozen dataset. The third uses the later memory-experiment snapshot with identical SQL. This is an overview across experiments, not a controlled three-way comparison. For the memory change alone, that later snapshot’s untuned medians were 170.1, 843.4, 393.2, and 3,206.3 ms, respectively.
Before applying that configuration, I ran a bounded concurrency check at both 16 and 64 MiB: three rounds with all four queries simultaneously, plus three rounds with four copies of the SEC query. The API and worker each have a two-connection application pool. That makes four queries a relevant check, though it is not a limit on every possible database client or a full load test.
Both profiles passed with identical query-result fingerprints, no cgroup out-of-memory events, and at least 8.7 GiB of host MemAvailable. Peak container-charged memory was about 1.0 GiB in those short checks, including file cache. That is observed usage for this working set, not a promise that a 2 GiB shared cache plus concurrent query operations will always use only 1 GiB.
I saved the previous configuration and applied the settings using ALTER SYSTEM, followed by a brief database restart. The settings persist in the PostgreSQL 18 data directory. The production app passed its health checks afterward. Autovacuum remains enabled in production; the test container’s 6 GiB cap and disabled autovacuum were not production tuning changes.
The memory experiment downloads include every timing sample, settings, result fingerprints, and the concurrency measurements. All six configurations and the repeated baseline returned identical results on this snapshot.
A couple of the actual SQL patterns
Here is the beginning of the Taiwan query. This is an excerpt from the measured statement; the downloadable SQL includes the later joins, scoring, and filters.
with canonical_revenue as (
  select distinct on (r.mops_company_id, r.period)
    r.mops_company_id,
    r.period,
    (r.revenue * case
      when r.unit = 'THOUSANDS' then 1000 else 1
    end)::numeric as revenue_twd,
    extract(year from r.period)::int as revenue_year,
    (extract(year from r.period)::int * 12
      + extract(month from r.period)::int) as month_index
  from mops_monthly_revenue r
  where r.currency = 'TWD'
  order by r.mops_company_id, r.period, r.revision desc
), latest_period as (
  select mops_company_id,
    max(period) as latest_revenue_period,
    max(month_index) as latest_month_index
  from canonical_revenue
  group by mops_company_id
)
-- rolling_revenue, annual_totals, annual_ranked,
-- annual_rollup, base_metrics, projected, valued, scored ...
Revenue gets revised, so I need the latest revision per company and month before adding things up. Then the query calculates complete annual periods, trailing twelve months, and recent-quarter growth. The complete statement has ten CTEs. This is a useful query for the product, and it gives the planner quite a bit to work through.
The SEC query has a similar pattern with a different reporting calendar:
with preferred as (
  select distinct on (sec_company_id, fiscal_year, fiscal_quarter)
    *
  from sec_financial_period
  order by sec_company_id, fiscal_year, fiscal_quarter,
    filed_at desc, revision desc, accession_number desc
), metrics as (
  select p.*,
    -- other metrics and prior-period joins omitted here
    sum(p.revenue) over (
      partition by p.sec_company_id
      order by p.fiscal_year, p.fiscal_quarter
      rows between 3 preceding and current row
    ) as ttm_revenue,
    row_number() over (
      partition by p.sec_company_id
      order by p.fiscal_year desc, p.fiscal_quarter desc
    ) as latest_rank
  from preferred p
  -- the full query also joins preferred for QoQ and YoY comparisons
)
-- latest_metrics and the final company/segment projection follow
The full query separately checks that the four quarters are consecutive before displaying trailing revenue. Four rows alone do not prove that.
What the plans actually showed
In representative paired plans, the Taiwan annual-revenue aggregate ran 400 times on both versions. Its estimated output was one row per execution; the actual average was about 245. The window/sort branch beneath it processed roughly 4,743 / 11,993 rows per execution. So there is still a fairly obvious piece of SQL to investigate separately.
Postgres 18 changed part of the surrounding join/sort plan and wrote fewer temporary blocks for this statement: 2,494 versus 2,776 in the median measured run. That is an observation from the plans, not proof that this one difference caused the whole speedup.
The SEC plan also changed. The representative 15 plan had six ordinary Sort nodes and two Incremental Sort nodes; 18 had three and four respectively. Yet its end-to-end execution median barely moved in the controlled comparison. A different-looking plan is not automatically a meaningful product improvement.
Postgres 18 also ran with io_method=worker and effective_io_concurrency=16; the latter was 1 on 15. The PostgreSQL 18 release notes describe its new asynchronous I/O subsystem. I left those version defaults in place. This experiment compares the versions as deployed; it does not isolate asynchronous I/O from planner changes, execution changes, or the smaller Alpine userspace update.
You can inspect the representative Postgres 15 Taiwan plan, Postgres 18 Taiwan plan, Postgres 15 SEC plan, and Postgres 18 SEC plan.
The Docker upgrade detail I would watch for
A major upgrade is not just changing postgres:15 to postgres:18 and pointing it at the same files. PostgreSQL documents dump/restore, pg_upgrade, or logical replication as the migration paths.
The official Docker image also changed its default data layout in 18. It normally uses /var/lib/postgresql/18/docker, with the volume mounted at /var/lib/postgresql.
My installation already had an external Docker volume backed by a specific NVMe bind mount and systemd dependencies. I retained that mount and explicitly set a versioned subdirectory:
environment:
  PGDATA: /var/lib/postgresql/data/18/docker
volumes:
  - hy-postgres-data:/var/lib/postgresql/data
That is an intentional custom PGDATA, not the image’s default layout. The restored 18 cluster lives in its own directory. I also pinned the exact image digest, so the next app deployment does not quietly select a different database build.
Keeping the old cluster is useful, but only up to a point. Once the app starts writing to Postgres 18, the old Postgres 15 copy is stale. Switching back without reconciling those writes would lose data. So the backup and the verification mattered more than whether the upgrade command itself looked simple.
What I take away from this
For these queries, on this server, the upgrade was useful. The Taiwan screen improved enough to notice, and the AI and power queries had better medians. The SEC query was roughly a wash once I controlled for rebuilding the database.
I am also glad I measured the restore separately. The active database went from 22.63 GiB to 13.93 GiB without dropping application rows. That is a useful maintenance result even though it does not belong in a claim about how much faster the new Postgres engine is.
The memory experiment was useful too, especially for power coverage and the SEC query. But neither a version upgrade nor eliminating temporary-file spills fixed the underlying shape of that Taiwan query. If I want it consistently under a second, I still need to look at the repeated aggregate and measure a query change. I did not rewrite the queries or add indexes as part of this upgrade.
The broader point from that March post still holds for me: it is getting much easier to do the maintenance, collect evidence, and find out what actually happened. I would rather have these tables of boring measurements than assume a new major version made everything faster.
Full measured SQL: AI screener, Taiwan growth screener, SEC screener, and power coverage. Raw timing samples and configuration.
The database dump stays private. The downloads contain query text, plans, settings, and timing measurements.